Chokepoint disruption and freight cost, by transmission stage and contract layer. Includes Hormuz, Suez, Malacca and Panama and what each controls, the five steps from transit drop to repriced invoice, how M1, M2 and M3 absorb the shock, and why transit counts lead the news, explained by the team behind the sirius freight cost index.
News of a chokepoint restriction (a conflict near a strait, a drought lowering canal water levels, a geopolitical flashpoint) tends to produce two reactions in corporate procurement teams. Some freeze while they wait for more information. Others assume the situation will resolve before their next invoice cycle. Both responses carry more financial risk than they appear to at first glance.
The cost impact of a chokepoint event is not a single shock that either hits you or passes you by. It is a sequence of market repricing events, each separated by weeks, each affecting a different slice of your freight contract portfolio. The companies that manage this well are not the ones with the best market intelligence in week one. They are the ones who understand the transmission pathway well enough to act during the quiet period before the second and third repricing waves arrive.
Table of Contents
- Which four chokepoints matter, and what do they control?
- How does a partial restriction become a freight cost event?
- Which contract layers absorb a chokepoint shock?
- Why does throughput data matter more than news?
- How does sirius track chokepoints?
Which four chokepoints matter, and what do they control?
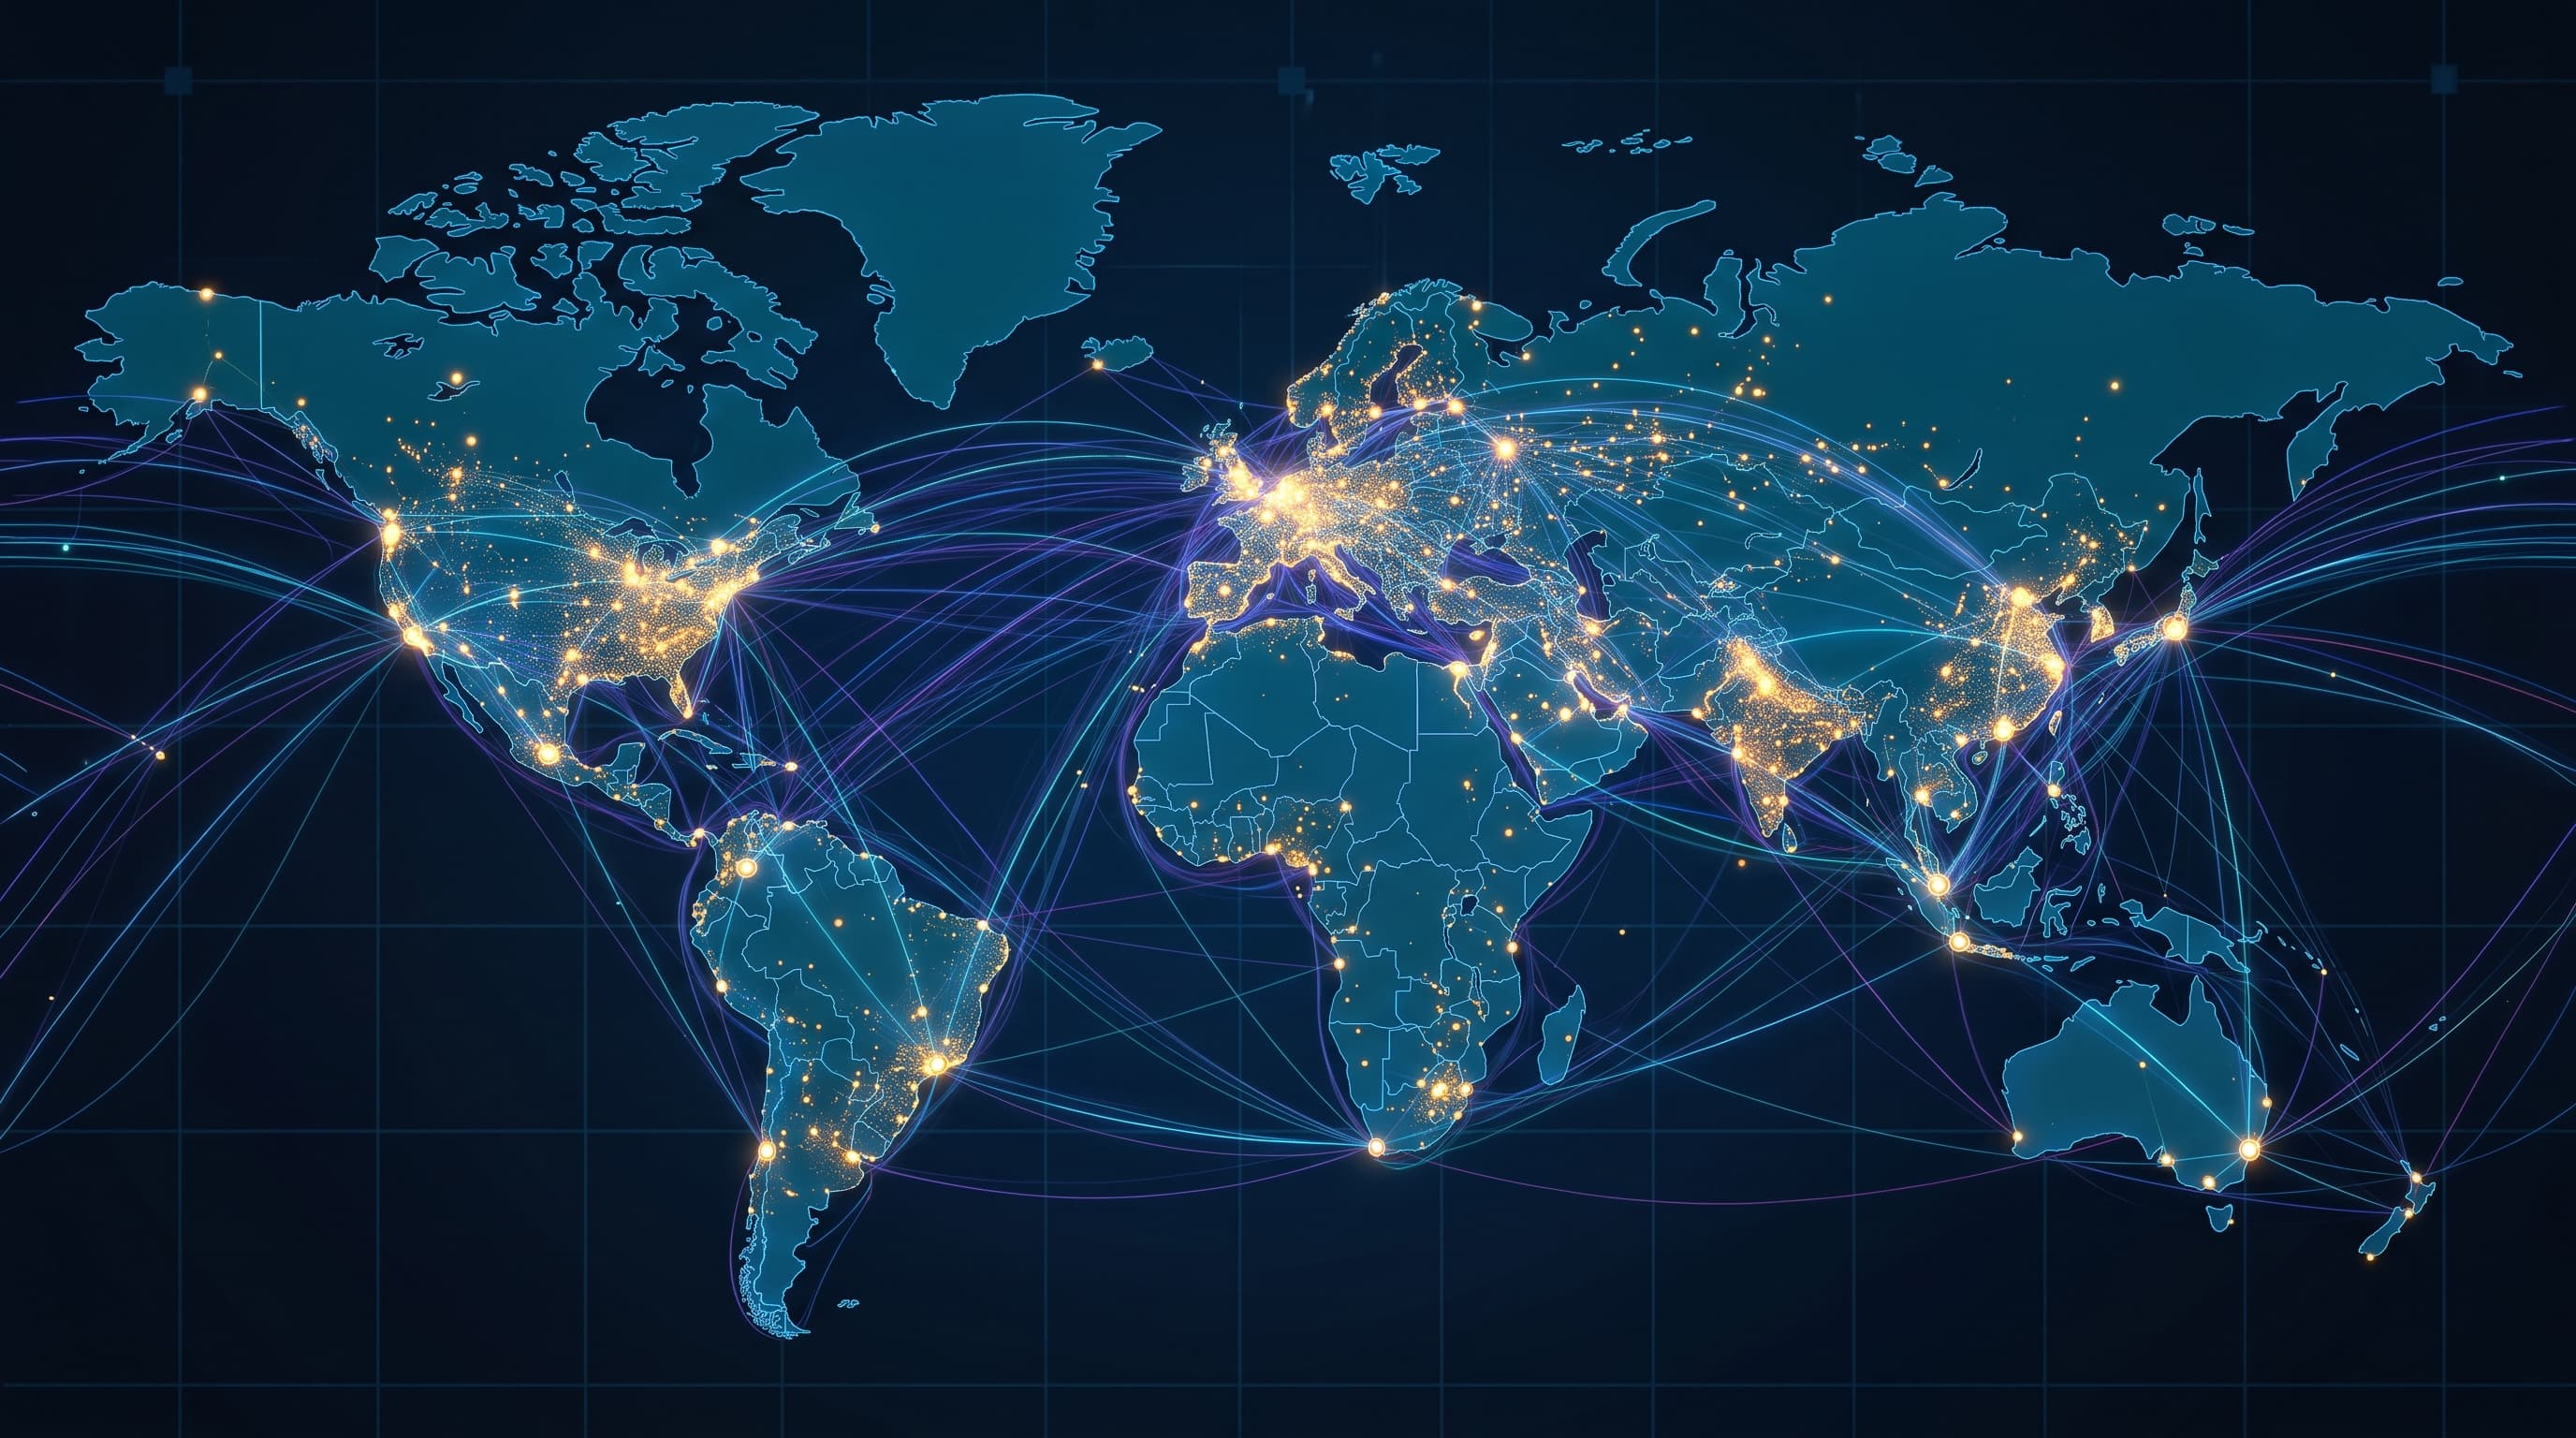
Four maritime passages carry enough of global trade that restrictions on any one of them register across multiple freight markets simultaneously. Each has a different risk profile and a different set of trade lanes downstream.
-
Strait of Hormuz: Primary exit route for Persian Gulf oil and LNG. Restrictions affect energy commodity pricing and the Middle East to Far East lane directly.
-
Suez Canal: The main passage between Europe and Asia for container shipping. Closure or restriction forces vessels onto the Cape of Good Hope route, adding 10-14 days and significant fuel cost.
-
Strait of Malacca: The primary corridor linking the Indian Ocean to the South China Sea. Critical for intra-Asia and Far East routing.
-
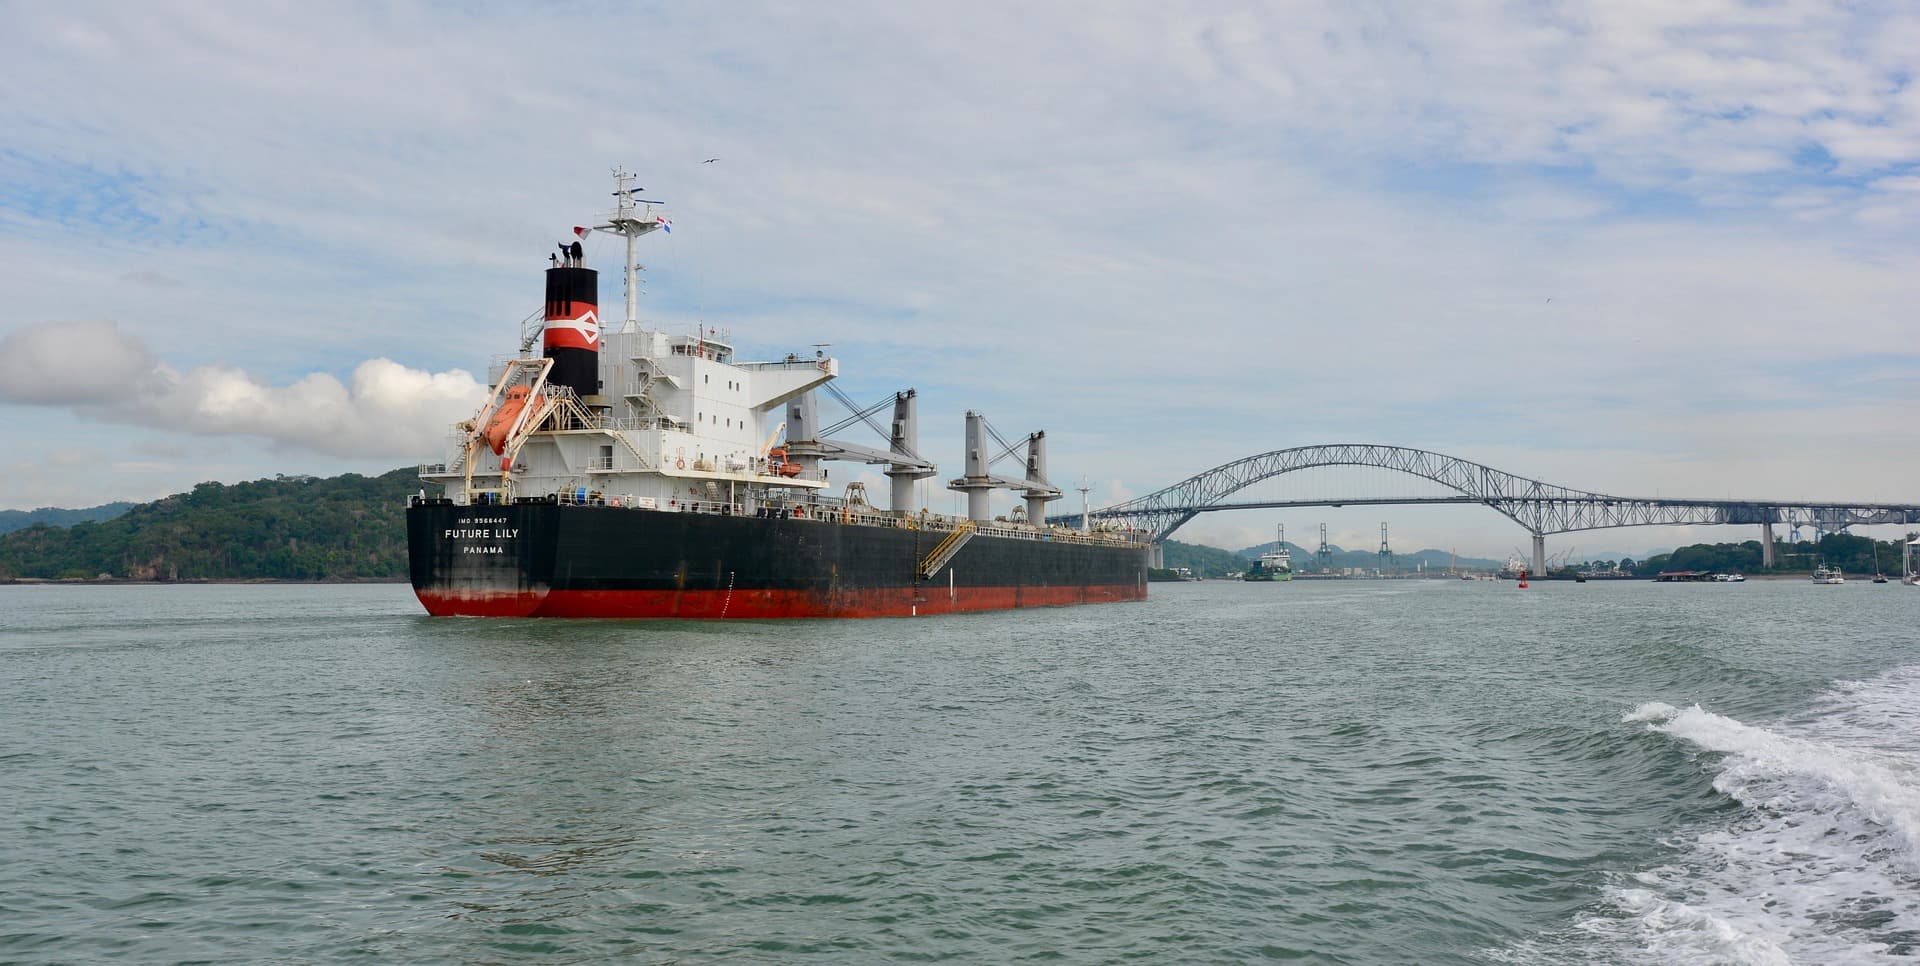
Panama Canal: Connects Pacific and Atlantic routes. Low water levels from drought can throttle transit capacity and force rerouting to Suez or around Cape Horn.
Each of these passages has a different threat profile. Hormuz and Suez face predominantly geopolitical and conflict-related disruption risk. Panama Canal disruptions are primarily hydrological: a function of rainfall in the Gatun Lake watershed. Malacca is more exposed to piracy and vessel congestion than to headline-making geopolitical events. The practical implication is that monitoring approaches need to differ: transit volume data tells a different story for each strait, and the market response timelines are not uniform.
How does a partial restriction become a freight cost event?
It is worth being precise here because the mechanism is often misunderstood. A chokepoint restriction does not cause carriers to immediately raise rates. What it does is set off a chain reaction in vessel routing and capacity availability that, over several weeks, produces a tightening in the markets that carriers then price into their rates.
- Transit volume through the affected passage falls, either because vessels are turned away, are rerouting preemptively, or because shippers are diverting cargo to alternative modes.
- Vessels that previously used that route are redeployed onto longer alternatives. A container ship rerouting around the Cape of Good Hope instead of through Suez adds roughly 10-14 days to the voyage. That vessel is out of the network for longer, which effectively reduces the capacity available for bookings on the same trade lane.
- As capacity tightens, carriers have more pricing power. Emergency surcharges (typically structured as a War Risk Surcharge, a Suez Canal Surcharge, or a Strait Transit Surcharge depending on the context) are declared first. These move quickly because they are outside standard contract terms.
- Rate benchmarks follow as the spot market reprices upward. Market indices capture this repricing within one to two weeks of the initial capacity tightening.
- Invoices reprice 30 to 90 days later, depending on your contract type. Spot buyers see the new rates on their next booking. Contract holders see it at the next rate review clause, quarterly renegotiation, or annual renewal.
The gap between step one and step five, the period between the first transit volume drop and the repriced invoice appearing in your accounts payable, is the window for proactive action. Companies that wait for the invoice have already lost it.
Which contract layers absorb a chokepoint shock?
Not all freight contracts reprice at the same speed, and this is where the outcome diverges sharply between companies on the same trade lane facing the same disruption. The sirius model segments exposure into three contract layers: M1, M2, and M3.
| Layer | Contract type | Repricing timeline | How chokepoint shocks land |
|---|---|---|---|
| M1 | Spot and short-term | Within 30 days | Absorbs surcharges and spot rate movements immediately. Highest exposure, fastest impact. |
| M2 | Quarterly contracts | 30-60 days | Absorbs at the next rate review. Carriers typically invoke force majeure or surcharge clauses within 4-6 weeks of a sustained restriction. |
| M3 | Annual and long-term | 60-90+ days | Protected until the next renewal window. If the restriction resolves before that date, the company avoids the impact entirely. If it persists, the full accumulated pressure enters at renewal. |
This is why two companies with identical freight volumes on the same trade lane can report completely different cost outcomes from the same chokepoint event. A company with predominantly annual contracts and a renewal date six months out may absorb almost nothing from a disruption that lasts eight weeks. A company running on quarterly spot renewals absorbs the same disruption at full market price within one billing cycle.
The implication for procurement strategy is not that long-term contracts are always preferable. Annual contracts protect against short disruptions but leave companies fully exposed to sustained pressure entering at the worst moment, when the market has already repriced and the disruption shows no sign of resolving. The answer is portfolio awareness: knowing what share of your freight exposure sits in each layer, so you can assess your net exposure when a chokepoint event begins to develop.
Note on contract clauses
Most annual ocean freight contracts include force majeure and exceptional circumstances clauses that allow carriers to pass surcharges through even within a fixed-rate period. Review your specific contract terms. M3 protection is never absolute during a sustained, documented disruption.
Why does throughput data matter more than news?
By the time a chokepoint disruption makes the front page of a logistics trade publication, the first wave of M1 cost is already locked in. Spot rates have moved. Emergency surcharges have been declared. The news is confirming what the freight market already priced three weeks earlier.
The earlier signal is vessel transit count data at each passage: specifically the deviation from that passage's historical baseline for the same week of the year. A 20% drop in transits at Hormuz is a more actionable signal in week one of a developing situation than a news article describing the political context in week three. Transit volume data does not require interpretation of intent or escalation probability. It simply measures whether vessels are moving through the passage or not.
The challenge is that raw transit data is noisy. Seasonal variation, weather-related slowdowns, and normal port call fluctuations all cause transit counts to move without any underlying disruption. Meaningful signal extraction requires normalization against a rolling baseline for each strait, so that a genuine deviation registers proportionally rather than being masked by seasonal patterns. This is also why single-point-in-time comparisons to historical disruption events can mislead: a 30% transit drop at Suez in January reads differently than the same drop in July, when eastbound container traffic is seasonally elevated.
How does sirius track chokepoints?
Chokepoint throughput is one of the six pressure dimensions in the sirius index, sitting alongside Fuel, Capacity, Surcharges, FX, and Environment. For each of the four major passages, sirius tracks vessel transit volume normalized against a rolling 12-month baseline. A partial restriction registers proportionally rather than as a binary on/off signal, because partial restrictions are, in practice, the most common form of chokepoint disruption. Full closure events are rare and typically resolved within days. It is the sustained partial restrictions, a 30% capacity reduction over 8 to 12 weeks, that do the most cumulative damage to freight cost budgets.
The chokepoint signal feeds into the lane-level pressure composite for the trade lanes most exposed to each passage. Hormuz throughput flows primarily into the Middle East to Far East and Far East to Middle East lanes. Suez flows into the Far East to Europe and Middle East to Europe lanes. Malacca feeds Intra-Asia and connecting lanes. Panama flows into the North America lanes with transpacific and transatlantic exposure.
For more on how chokepoint signals are normalized and weighted, see the crisis analog methodology and the pressure model documentation.